How to Use OPE Market Data to Set Targets and Keep Your Dealership Competitive

Some seasons, it feels like you can do everything “right” and still end up long on the wrong units and short on profit. The weather shifts, demand moves, and suddenly the mix that worked last year doesn’t quite land this year. When that happens, it usually isn’t because you stopped working hard. It’s because the market moved, and the numbers didn’t get checked soon enough.
The dealers who stay steady usually have one thing in common: they know what “healthy” performance looks like for a store like theirs, and they regularly check their own numbers against that picture. That’s all a benchmark really is: a way to tell if you’re in a good range, a little ahead, or starting to fall behind.
In this post, we’ll break down benchmarks in plain language, show how to line up market data with your own numbers, and share an easy 30‑minute monthly routine you can use to stay competitive and protect your dealership’s profitability.
Click to Jump Ahead:
1. Benchmarks: What “Healthy” Looks Like for OPE Dealers
Healthy performance looks a little different at every OPE dealership, but the idea behind it is simple. You need a clear picture of what “good” looks like and a way to see how close you are to that picture.
At its core, that picture is made up of benchmarks, which are numbers that show whether your business is in a healthy range, slipping, or improving. In plain terms, benchmarks answer questions like:
- Are we doing better or worse than we were this time last year?
- Are we roughly in line with where other OPE dealers are, or way off the mark?
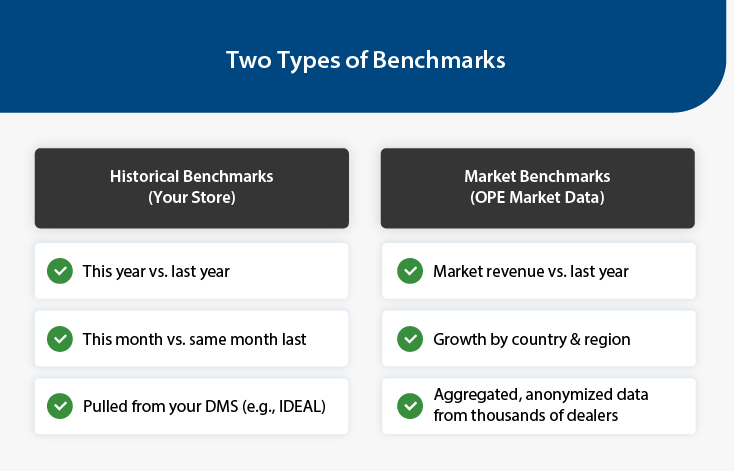
To get there, you’re really looking at two types of benchmarks:
- Historical benchmarks – Your own track record
Think: this year vs. last year, or this month vs. the same month last year. Every dealership has this type of information in its own system. In IDEAL, dealers have reports that make it easy to see these year‑over‑year and month‑over‑month trends by product line, department, or brand, so you can tell if you’re moving in the right direction inside your own four walls. - Market benchmarks – the bigger picture
This is the bigger picture: how total OPE revenue is changing across thousands of dealers, and how that growth (or decline) looks by country and region. Constellation’s OPE market data reports show monthly revenue and year‑over‑year growth for the overall market, plus separate views for the U.S., Canada, and major U.S. regions. It tells you whether the market is growing, flattening, or softening.
 Used together, these two views give you a practical definition of “healthy”:
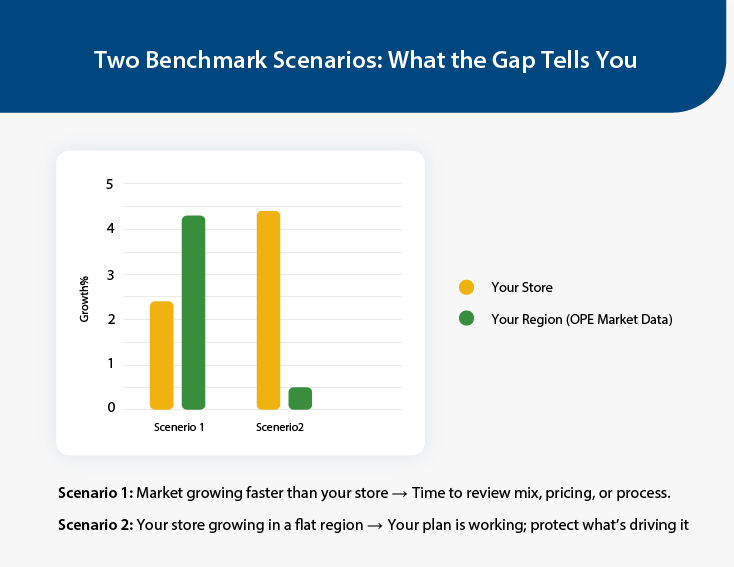
- If your IDEAL reports show you’re up 5%, but the OPE Market Update shows your region is up 15%, you’re probably leaving something on the table.
- If your region is flat but you’re growing, that’s a strong sign your current plan is working and worth protecting.
These benchmarks do several important jobs.
They help guide everyday decisions: stocking, pricing, staffing, and marketing all get easier when you know what a healthy range looks like. You’re not guessing whether to lean into a category or pull back; the benchmarks help point the way.
They also help reduce reliance on habit. “What we’ve always done” only works if the market never changes. Benchmarks help you spot when the market has moved so your plan can move with it.
In the next section, we’ll look at how Constellation’s OPE market data report provides that market benchmark view, and how you can put it to work alongside your IDEAL reports.
Read Next: How Embedded Payments Put Real Money Back Into Your Store
2. Using OPE Market Data to Check if You’re in Step with the Market
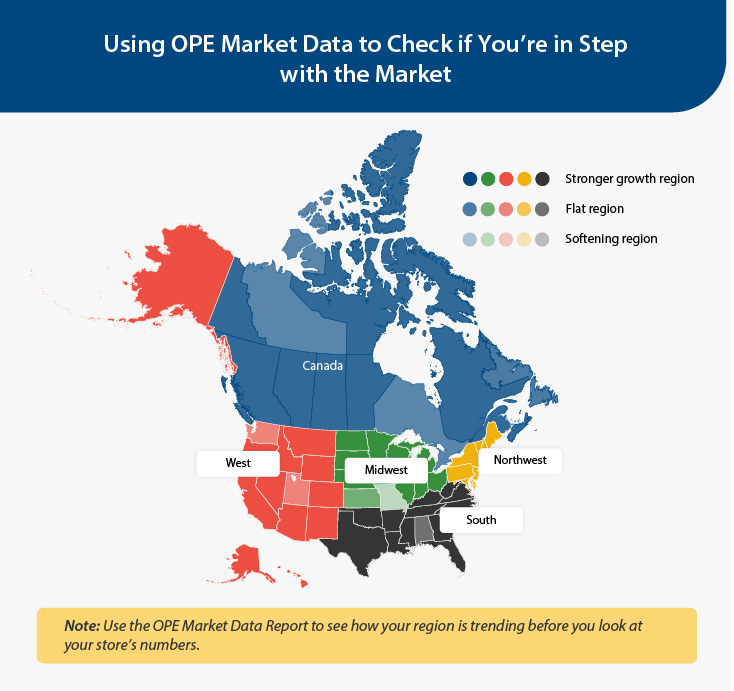
Once you’re clear on what “healthy” looks like, the next step is to check whether your dealership is moving with the overall OPE market or drifting away from it. That’s where the OPE Market Data Report comes in.
Each monthly OPE market data report gives you a high‑level snapshot of:
- Total OPE market sales for the month
- Year‑over‑year revenue growth for the last three years
- How revenue growth is trending by country and region (U.S. vs. Canada, plus Northeast, Midwest, South, and West)
In a few charts, you can see whether the market has been:
- Growing steadily, flattening out, or pulling back
- Stronger or weaker in your region compared to others
- Experiencing any sharp swings in particular months
On its own, this doesn’t replace the detailed category‑level reports dealers have in IDEAL, but it does give dealers an important “sanity check”:
- If the OPE Market Update shows strong growth in your region and your total revenue is flat or down, that’s a sign to dig into your mix, pricing, or processes.
- If the market is soft in your region but your store is holding steady or growing, that tells you your current plan is working and you may want to protect what’s driving that strength.
From there, you can go back into IDEAL and look at your key lines and categories (zero‑turns, compact tractors, handheld, parts, service) to understand where you’re ahead or behind. The OPE market data report gives you the big picture. Your IDEAL reports show which parts of the business are actually creating that gap.
Because the OPE Market Update is built from aggregated, anonymized data across thousands of dealers, you’re looking at broad OPE dealership benchmarks, not any one store’s performance. Your own IDEAL numbers stay internal, and you use them privately to see how you stack up against the wider market.
3. Using OPE Market Data Updates to Fine‑Tune Month by Month
Big‑picture benchmarks are useful for planning your overall product mix, but you still need a way to steer the ship month by month. That’s where the ongoing OPE market data updates play a key role.
These monthly reports show how total OPE revenue is moving month to month, and how year‑over‑year growth looks in different regions. In a few minutes, you can see:
- Which months have been especially strong or soft across the market
- Whether growth in your country or region is picking up or slowing down
- Any noticeable shifts in seasonal timing — for example, if demand is peaking earlier or later than in prior years
Each time a new OPE Market Data Update is published, you can ask a few simple questions:
- Do we need to slow or accelerate orders in any of the lines we carry?
- Should we move certain products forward on the lot, or feature them more prominently online?
- Is the market telling us that customers are shifting into or out of a specific category?
From there, you can make small but meaningful adjustments, such as:
- Trimming back orders in a category the data shows as softening, while planning a promo to help move what’s already on hand.
- Giving extra front‑line space, signage, and digital promotion to a category that’s clearly gaining momentum.
- Tweaking staffing and parts planning so you’re ready to support the lines that are trending up.
When you use the monthly OPE Market Data alongside your own IDEAL numbers, you get a practical way to make small, monthly course corrections instead of scrambling with last‑minute reactions when the season is already getting away from you.
Read Next: Dealership Inventory Management Guide
4. How to Pull the Right Numbers from IDEAL to Compare with the Market
OPE market data gives you the big picture, but the real power comes when you line it up with your own numbers. That’s where your DMS reports come in.
First, think about a short list of “must‑see” numbers you want to track every month. You don’t need 20 reports, just a few metrics you can look at consistently:
- Units sold by main product category
(for example: zero‑turns, compact tractors, handheld equipment) - Gross profit per unit by category
- Parts sales and a basic sense of inventory turns
- (Optional) Service metrics, such as hours sold and effective labor rate, if you want to bring fixed ops into the picture
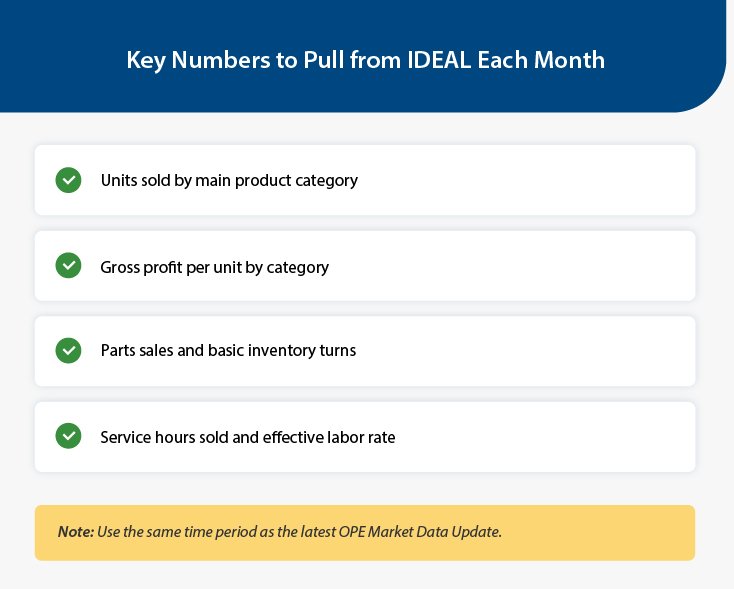
Whatever system you use, those numbers live in your own data. In IDEAL, dealers have access to reports that make it easy to pull year‑over‑year and month‑over‑month results by category, department, or brand. The key is to pull them for the same period covered in the latest OPE market data update, so you’re making a fair comparison.
When you put the two side by side — OPE market data on one hand, and your IDEAL reports on the other — patterns start to stand out:
- A category that’s growing in the market but flat in your store
- A line where your volume is strong but margins are thinner than you’d like
- A product type where both the market and your store are soft, signaling it’s time to be cautious
Those IDEAL reports are your internal business information; they’re not shared as part of the public market summaries. You decide who inside your dealership sees them. The external OPE market data simply gives you context, so those internal numbers are easier to read and act on.
If you’re already using IDEAL, you don’t have to do this alone. Our team is offering a complimentary 20–30 minute Dealer Performance Benchmark Review for IDEAL dealerships. Contact your IDEAL rep today!
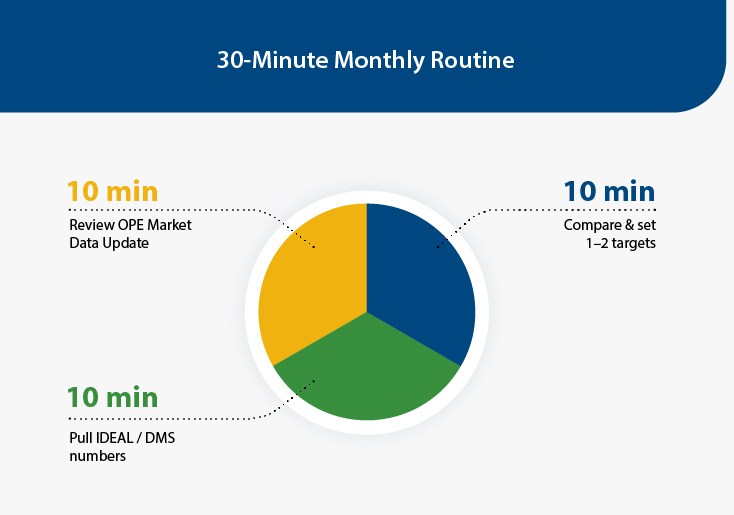
5. A 30‑Minute Monthly Routine Any Dealer Can Follow
You don’t need a data team to get value out of OPE market data. A simple, 30‑minute routine once a month is enough to keep your targets fresh and your decisions grounded in real numbers.
Here’s a straightforward cadence you can follow.
- Review the latest OPE market data update
Take 5–10 minutes to skim the newest update. Focus on:
-
- Which months are up, down, or holding steady in the charts
- How growth looks in your country and region vs. others
- Any notes about shifts in timing (demand coming earlier, stretching longer, or dropping off sooner)
Jot down 2–3 quick takeaways that matter for your store.
- Pull your key numbers in IDEAL (or your DMS)
Now switch to your own store:
-
- Total revenue for the last month or period
- Units sold and gross profit by your main categories
- Any parts or service numbers you’ve decided to track
However you structure your reporting, the key is to pull the same set of metrics every month so you can see patterns.
- Ask three simple questions
With the OPE market data update in mind and your IDEAL numbers in front of you, ask:- Are we moving in the same direction as the market overall, or are we out of step?
- If our region is strong, are we seeing that strength in our store? If not, why not?
- Do we need to adjust inventory, pricing, or attention based on what we see?
You’re not looking for perfection here. Just honest signals about where you might be out of sync with the wider OPE market.
- Set one or two specific targets for next month
Turn those signals into clear actions, such as:- “Tighten ordering slightly going into what looks like a softer month, and plan a focused promo to keep traffic up.”
- “Lean into our stronger months with more front‑line space and digital promotion.”
- “Review pricing in lines where market growth is strong but our margins are thin, to support better OPE dealer profitability.”
Keep targets small and concrete so they’re realistic for your team.
- Repeat next month and compare
When you run this routine again:- Celebrate where you hit your targets or saw improvement.
- Where you didn’t, adjust the plan. Treat it as ongoing course correction, not failure.
Over time, this quick monthly habit turns OPE market data and OPE dealership benchmarks into something practical: a steady rhythm of small, informed changes that help keep your dealership competitive and your margins moving in the right direction.
Stay Competitive by Staying in a Healthy Range
You don’t have to guess what “good” looks like anymore. With anonymized, aggregated OPE market data on one side and your own IDEAL reports on the other, you can see:
- Whether your overall performance lines up with what’s happening in the broader market
- Where your dealership is ahead of the trend and where you might be leaving profit on the table
- How your store is really trending over time, not just how it felt last month
The goal isn’t to beat the dealer down the road. It’s to keep your own store in a strong, competitive range — stocked sensibly, priced smartly, and making decisions grounded in real numbers.
This month, pick one important product line or department. Review what the latest OPE market data says about how the market is moving overall, pull the matching numbers in IDEAL, and set one small, concrete target for next month.
Then repeat.
Those small, data‑backed moves are what add up to a healthier, more profitable dealership.
Get This Month’s OPE Market Report Now!
Curious how your store stacks up on service efficiency, parts performance, and gross profit vs. top OPE dealers?
Book a short, complimentary Dealer Performance Benchmark Review with your IDEAL representative to compare your numbers with the latest Dealer Insight benchmarks and uncover concrete opportunities to improve.